
Discover why real estate agents are invaluable in today's market, from expert guidance and market insights to personalized support and negotiation skills. Learn how Winans & Associates champions your real estate success.


Bakersfield, population 377,917 (2019) and growing.
For as long as I’ve been working here (since 2010), Bakersfield has been extremely popular with investors. Whether one is looking to flip, or aspires to build a portfolio of rentals, Bakersfield’s dynamics are ideal for meeting one’s goals. For example, 25% percent of households in Bakersfield, CA. are renting their home (RENTcafé). With a massive pool of renters constantly churning, demand for rentals has always been high, and continues to squeeze higher. Although values are up significantly from last year (see info. below), Bakersfield remains one of the more affordable cities in California. This has buyer and renters alike, flocking to Bakersfield in droves. Let’s look at the data.
Current year to date (Jan. 1, 2021 to May 31, 2021) sales are at 2,980, which is up 33% from the same timeframe in 2020.

Price per square foot for the current year to date is sitting at $176, up 15.8% from the same timeframe in 2020.
Note: In May 2021 the price per square foot is at $186, up 21.6% from May 2020.

The average days on market for the current year to date is just 21 days, which is down 36.4% from the same timeframe last year.

The average sold price for the current year to date is $326K which is up a whopping 19% from the same timeframe last year!

At our current burn rate, the remaining months of inventory sits at just 0.6, down a mind-blowing 65.6% from this time last year.

Despite being in such an aggressive seller’s market, we’ve been able to secure homes for our buyers and beat out multiple offers in the process. If you’re looking to buy or sell, or if you just have questions about the market, we’d love to help you. Give us a call today!

April 2020 is a Seller's market! The number of for sale listings was down 21.9% from one year earlier and up 5.4% from the previous month. The number of sold listings decreased 34.8% year over year and decreased 19.3% month over month. The number of under contract listings was down 4.8% compared to previous month and down 22.8% compared to previous year. The Months of Inventory based on Closed Sales is 2.1, up 22.9% from the previous year.
The Average Sold Price per Square Footage was down 0.6% compared to previous month and up 6.2% compared to last year. The Median Sold Price increased by 3.9% from last month. The Average Sold Price also increased by 0.4% from last month. Based on the 6 month trend, the Average Sold Price trend is "Appreciating" and the Median Sold Price trend is "Appreciating".
The Average Days on Market showed a neutral trend, a decrease of 3.3% compared to previous year. The ratio of Sold Price vs. Original List Price is 99%, an increase of 1% compared to previous year.
Market Snapshot

Property Sales (Sold)
April property sales were 401, down 34.8% from 615 in April of 2019 and 19.3% lower than the 497 sales last month.
Current Inventory (For Sale)
Versus last year, the total number of properties available this month is lower by 235 units of 21.9%. This year's smaller inventory means that buyers who waited to buy may have smaller selection to choose from. The number of current inventory is up 5.4% compared to the previous month.
Property Under Contract (Pended)
There was a decrease of 4.8% in the pended properties in April, with 501 properties versus 526 last month. This month's pended property sales were 22.8% lower than at this time last year.
The Average Sold Price per Square Footage is Neutral*

The Average Sold Price per Square Footage is a great indicator for the direction of property values. Since Median Sold Price and Average Sold Price can be impacted by the 'mix' of high or low end properties in the market, the Average Sold Price per Square Footage is a more normalized indicator on the direction of property values. The April 2020 Average Sold Price per Square Footage of $155 was down 0.6% from $156 last month and up 6.2% from $146 in April of last year.
* Based on 6 month trend – Appreciating/Depreciating/Neutral

The Days on Market Shows Neutral Trend*
The average Days on Market (DOM) shows how many days the average property is on the market before it sells. An upward trend in DOM trends to indicate a move towards more of a Buyer’s market, a downward trend indicates a move towards more of a Seller’s market. The DOM for April 2020 was 29, down 17.1% from 35 days last month and down 3.3% from 30 days in April of last year.
The Sold/Original List Price Ratio Remains Steady**
The Sold Price vs. Original List Price reveals the average amount that sellers are agreeing to come down from their original list price. The lower the ratio is below 100% the more of a Buyer’s market exists, a ratio at or above 100% indicates more of a Seller’s market. This month Sold Price vs. Original List Price of 99% is up 1% % from last month and up from 1% % in April of last year.
* Based on 6 month trend – Upward/Downward/Neutral
** Based on 6 month trend – Rising/Falling/Remains Steady

The Average For Sale Price is Neutral*
The Average For Sale Price in April was $333,000, up 2.1% from $326,000 in April of 2019 and up 0.6% from $331,000 last month.
The Average Sold Price is Appreciating*
The Average Sold Price in April was $282,000, up 7.2% from $263,000 in April of 2019 and up 0.4% from $281,000 last month.
The Median Sold Price is Appreciating*
The Median Sold Price in April was $267,000, up 8.5% from $246,000 in April of 2019 and up 3.9% from $257,000 last month.
* Based on 6 month trend – Appreciating/Depreciating/Neutral
Bakersfield
Published: May 2020*
Property Types: All Residential Prop - All Properties
Price Range: $0 - No Limit SQFT Range: 0 - No Limit
Bedrooms: 0 - No Limit Bathrooms: 0 - No Limit
Year Built: 0 - No Limit
Months Of Inventory Based On Closings

A comparatively lower Months of Inventory is more beneficial for sellers while a higher months of inventory is better for buyers.
*Buyer’s market: more than 6 months of inventory Seller’s market: less than 3 months of inventory Neutral market: 3 – 6 months of inventory
Months of Inventory based on Closed Sales
The April 2020 Months of Inventory based on Closed Sales of 2.1 was increased by 22.9% compared to last year and up 31.2% compared to last month. April 2020 is Seller's market.
Months of Inventory based on Pended Sales
The April 2020 Months of Inventory based on Pended Sales of 1.7 was the same compared to last year and up 13.2% compared to last month. April 2020 is Seller's market.
Absorption Rate
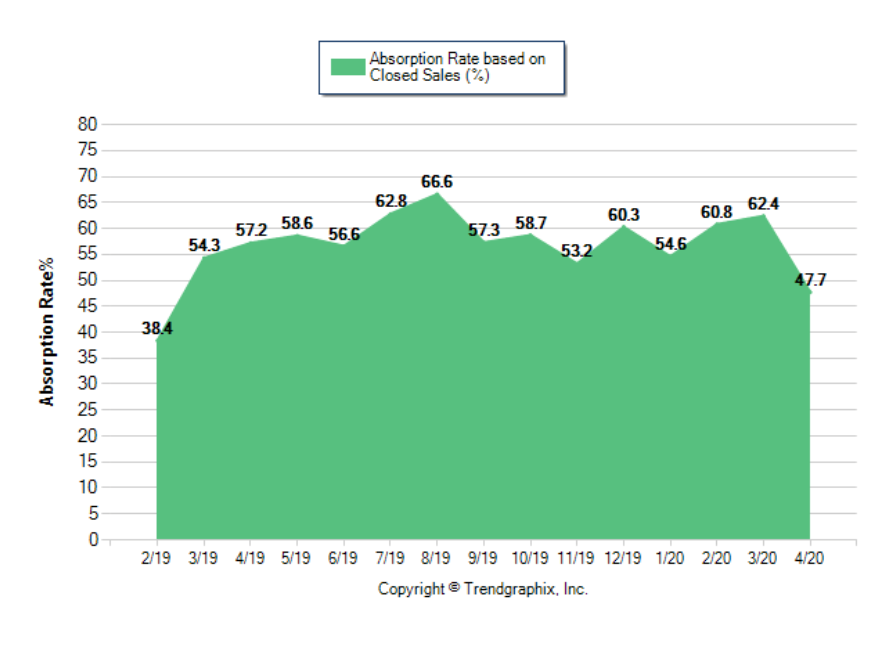
Absorption Rate measures the inverse of Months of Inventory and represents how much of the current active listings (as a percentage) are being absorbed each month.
*Buyer’s market: 16.67% and below Seller’s market: 33.33% and above Neutral market: 16.67% - 33.33%
Absorption Rate based on Closed Sales
The April 2020 Absorption Rate based on Closed Sales of 47.7 was decreased by 16.6% compared to last year and down 23.6% compared to last month.
Absorption Rate based on Pended Sales
The April 2020 Absorption Rate based on Pended Sales of 59.6 was decreased by 1.3% compared to last year and down 9.7% compared to last month.
All reports are published May 2020, based on data available at the end of April 2020, except for the today stats. All reports presented are based on data supplied by the Bakersfield MLS. Neither the Association nor its MLS guarantees or is in anyway responsible for its accuracy. Data maintained by the Association or its MLS may not reflect all real estate activities in the market. Information deemed reliable but not guaranteed.
You did it! You put in the work to build your credit. You tightened your belt to save the down payment, and now your time has come. It’s time to buy a house!
Now, you may be thinking “whoa, not so fast. Am I really ready for this?” I get it! On the surface, the home buying process can seem overwhelming, especially to a “first timer.” However, I believe that if you better understand the process, you will see that it’s usually very easy, and can be quite fun!
Before you get started, it’s important to determine who you’re going to be working with. Choosing a Realtor® is very important step in ensuring that your first experience is a good one. No transaction is identical. Having an experienced Realtor® to help you navigate the potential pitfalls can be invaluable.
If you haven’t already chosen a lender, your Realtor® will likely be able to refer one to you. This can be very helpful because their referral will likely be someone they’ve worked with, and had a positive experience with, in previous dealings.
Before you go “house shopping” you’re going to want to get pre-approved through your lender. This will require a little bit of paper work, but will give you an advantage over competing buyers, and may save you from heartache/headache (it’s no fun to find your perfect home, only to find that you aren’t qualified to buy it). In getting pre-approved, you and your lender will work together to determine how much home you can comfortably afford.
You’ve found it, you’ve found THE house (or at least the one that meets most of your “must have’s”). Now what? How do you know what to offer? What concessions do you ask for? Ask your Realtor® and trust their response! Markets vary, and depending on what type of market you find yourself in, your approach to making an offer will vary too. Your Realtor® is going to equip you with what you need to make an educated decision.
So, you’ve worked a deal out and have entered a contract with a seller, where do we go from here? The agents involved in the deal are going to deliver the contract to a local, and hopefully reputable title company. In California we “open escrow.” You will need to “put some skin in the game,” so this is when you deliver your earnest money, or the deposit amount that was negotiated. A properly constructed contract will have protection in place for your earnest money (i.e. making it contingent upon inspection and appraisal).
Inspections. Not required, ALWAYS recommended! This is your opportunity to uncover any potential defects with the property. For most people, buying a home is the largest investment they’ll ever make. The last thing anyone wants is to buy a money pit. By having a licensed property inspector comb through the property, you are better equipped to decide if/how you proceed.
*Important Note: Inspectors are paid to find things. They will ALWAYS find things. A big report doesn’t mean you have a lot of problems, and it’s unrealistic to ask the seller to fix everything on the report. Narrow down a list to just the major items, and send it off to the seller. Chances are they weren’t even aware of them. With cool head and creative approach, a deal can usually be made.
You’re approaching the end of the transaction. You’ve done your diligence, and your lender has done theirs. This is the home stretch. Not much left to do but to sign title/escrow docs that are required to transfer title into your name. Though it may feel like the work is done, and you can coast across the finish line, it is important to note that many deals have fallen apart right before closing. This may happen for a myriad of reasons, but more often than not it’s a buyer that makes a decision that affects their credit. This is why I tell all of my clients to not do ANYTHING that would affect their credit, until after closing. So no cars, boats, planes, or vacation homes.
That’s it, docs are all signed, monies are all wired, and title has released the file to the county recorder’s office. You did it. Congratulations, and welcome home.